-
-
Yeah science, you know - theory, experiment, record results, ask new questions - rinse and repeat. Science."Never argue with stupid people, they will drag you down to their level and beat you with experience". Mark TwainComment
-
Ok, Gold.Originally posted by scooterscot View Post
Long or short? Target price to open the position? Target price to close it? Etc.
For me it would be: Long; open at the market (currently $1920); no target price but close position if price falls below 200dma.Last edited by DealorNoDeal; 12 October 2020, 19:10.Scoots still says that Apr 2020 didn't mark the start of a new stock bull market.Comment
-
I was an academic scientist before I became a mercenary ****, so I can spot your bs from another galaxy.Originally posted by scooterscot View Post
What scientific journals or research groups are focused on technical charting? Obviously, none, because it's flat earth theory. It is nothing more than the subjective identification of geometric shapes by a shape fairy.
There's shedloads of work on the statistical modeling of financial time-series (based on time-series as realizations of random processes). Technical charting, not so much.
I venture that the only academic work you'll see on technical charting is in sociology, i.e., why uneducated, gullible, retail investors like you fall for it
Comment
-
I wonder why you left...Originally posted by jamesbrown View Post
Read my post again. I wonder if people forgot how to read.
Read, and read again. Where did I say charts are based on science? I din't. I said 'the science will be the same' in that we take a scientific approach as I described above.
That approach is scientific, we look at what happened, theorise, experiment, record, and asked new questions. Rinse and repeat. I believe that's the scientific method.
And yes there are plenty of journals describing human psychology. Greed and fear are well understood.
My goodness there's a plethora of papers out there on TA I never even knew about!
Technical analysis as the representation of typical cognitive biases
If you spent less time looking for holes you might learn something new."Never argue with stupid people, they will drag you down to their level and beat you with experience". Mark TwainComment
-
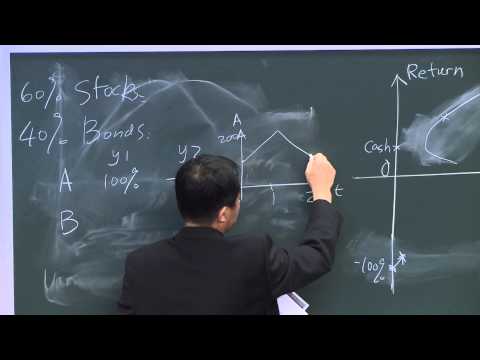
Here's a MIT lecture
MIT 18.S096 Topics in Mathematics with Applications in Finance, Fall 2013 - portfolio management
There'll be no science here - just tea leafs
My own portfolio management is contained to a single page of A4 -
 "Never argue with stupid people, they will drag you down to their level and beat you with experience". Mark Twain
Comment
-
Pooper had to come and Lord it over everyone with his reputation following around his ankles didn't he..
FOS'CUK forum personality of 2011 - Winner - Yes really!!!!
Comment
-
I left to get rich.Originally posted by scooterscot View Post
That's the noddy, bedtime story, version of science for morons that don't know any better.
Like I said, there are almost certainly no journals or researchers with any credibility working on "technical analysis" outside of sociology or psychology because it's voodoo astrology and completely orthogonal to the idea of financial time-series as realizations of random processes. The sociologists and psychologists are interested in things like mob psychology and shared delusions; the cretinisms of crowds - they're not interested in your arbitrary shapes, scootie, but what your belief in them says about you
Comment
-
It's a duck!Originally posted by scooterscot View PostOld Greg - In search of acceptance since Mar 2007. Hoping each leap will be his last.Comment
-
I still firmly believe long term buy and hold is the best strategy but FWIW...
Simple investment strategy
If you do this religiously, with discipline, for years on end, it has been shown that it can outperform the market. It tries to extract the most momentum out of bull markets and limit the downside, in bear markets, by switching into bond/money market funds.
It's best done with a provider that offers free switching. Ie. no dealing charges, and definitely no bid-offer spread with UTs and OEICs.
For simplicity, I've described just holding one fund at a time. For a bit more diversification, you could pick the top 2 or 3 funds. (NB. there's little point in going for more than one fund unless they're in different sectors of the market. For example, holding two Japanese funds or two tech funds doesn't provide much diversification.)
Start:
Rank funds by descending 6-month % performance.
Invest in the 1st placed fund (the one with the best 6-month % gain).
At the beginning of every month:
If the currently held fund is no longer somewhere near the top of the 6-month ranking, sell it and switch to the new 1st placed fund*.
* switching requires a bit of discretion (and common sense). For example, you may want to skip the month if
(a) the currently held fund is in the same sector (eg. biotech) as the new 1st place fund
OR
(b) there isn't much performance difference between the current fund and the new 1st place fund (eg. 35% vs 40%)
If you want to investigate further, don't ask me, DYOR. Google keywords like sector fund rotation, relative strength, momentum EMH anomaly.Last edited by DealorNoDeal; 13 October 2020, 06:00.Scoots still says that Apr 2020 didn't mark the start of a new stock bull market.Comment

All times are GMT. This page was generated at 02:18.
Comment