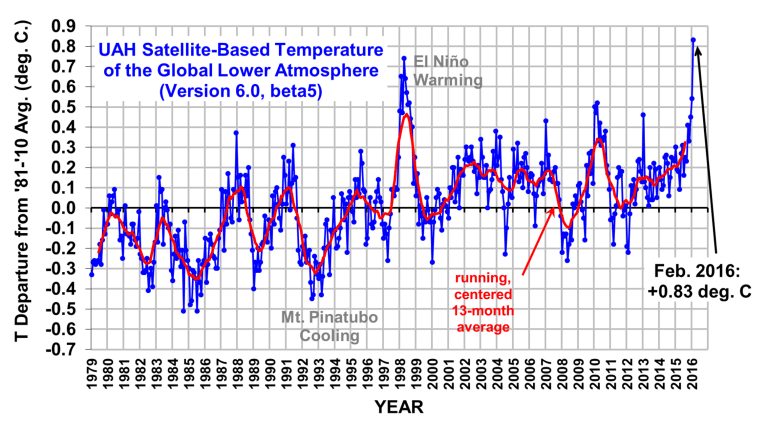
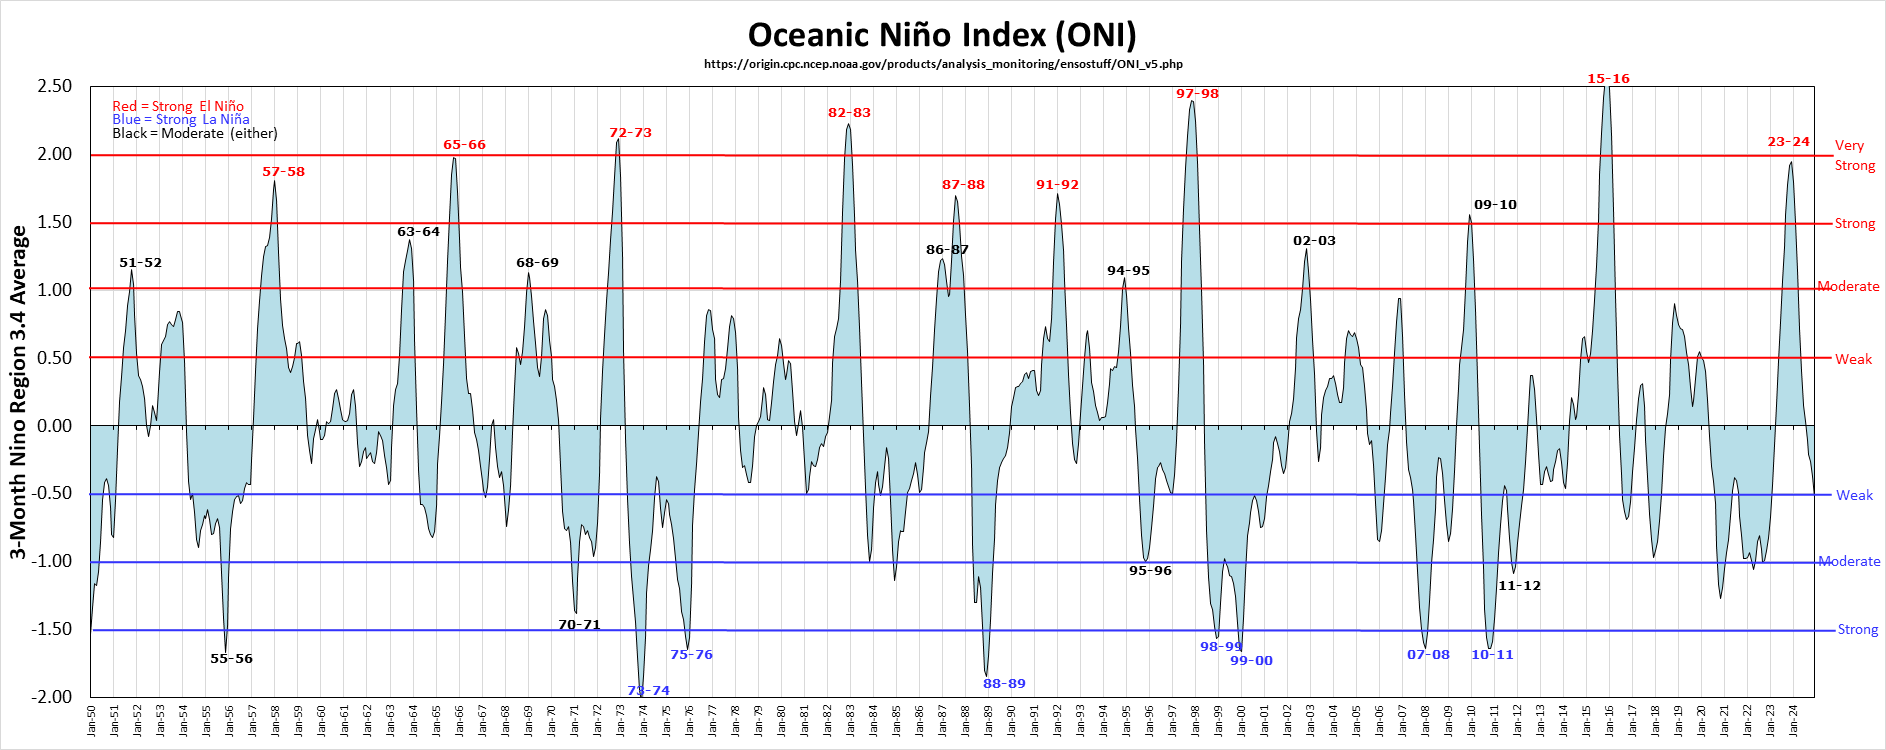
In other news, the estimates of the temperature of the lower troposphere for February as measured by satellite have just been released. Two organisations crunch the numbers, Remote Sensing Systems (RSS), a private sector group, and University of Alabama Huntsville (UAH). Both announced the hottest month on record, unsurprising given the influence of El Nino superimposed on AGW.
Why does this matter? After all, nobody lives in the troposphere. Well it ends a period when this particular measure had indicated a slowdown in the rate of warming, as opposed to thermometer readings at the planetary surface, which never really paused.
Lord Monckton of Benchley, to name but one,liked loved this 'Pause'. He posts an error-strewn monthly update at the blog WattsUpWithThat, usually entitled something like
The Pause lengthens yet again | Watts Up With That?
And he would compare the early IPCC projections with these observations, inevitably casting the IPCC's efforts in an unfavourable light. However, he dwelt exclusively on the RSS numbers, and over a specific period beginning at the last El Nino spike; the only dataset in which the pause existed. Other datasets, of which there are many, were just airbrushed out.
And for comparison he selected just one out of four IPCC scenarios, one which did not actually materialise, airbrushing out the projections that did accurately model the relationship between GHG concentrations and temperature.
Pure fraud. This man is not to be trusted. Strangely, his report for February seems to be held up.
Why does this matter? After all, nobody lives in the troposphere. Well it ends a period when this particular measure had indicated a slowdown in the rate of warming, as opposed to thermometer readings at the planetary surface, which never really paused.
Lord Monckton of Benchley, to name but one,
The Pause lengthens yet again | Watts Up With That?
And he would compare the early IPCC projections with these observations, inevitably casting the IPCC's efforts in an unfavourable light. However, he dwelt exclusively on the RSS numbers, and over a specific period beginning at the last El Nino spike; the only dataset in which the pause existed. Other datasets, of which there are many, were just airbrushed out.
And for comparison he selected just one out of four IPCC scenarios, one which did not actually materialise, airbrushing out the projections that did accurately model the relationship between GHG concentrations and temperature.
Pure fraud. This man is not to be trusted. Strangely, his report for February seems to be held up.

Comment